3 exchangesBinance, Bybit y Gate
poolcod
INTELIGENCIA DE LIQUIDEZ
database
query_stats
bolt
radar
Mapa de liquidez y liquidaciones de Bitcoin.
Estimated pools, real liquidations, a market radar and multi-market context gathered into one surface.
30 marketsPopular USDT perpetuals
Real timeLive streams and price
Market radarProximity and imbalance
COMUNIDAD POOLCOD
Datos para análisis. No constituye asesoramiento financiero.
poolcod
LIQUIDITY MAP AND RADAR
See where liquidity is concentrated before you trade.
Compare 30 markets, estimated zones, real liquidations and radar insights in one view.
48-hour Pro trial, no card
Full access for new users
poolcod
Idioma
Bienvenido
Accede a tu mapa privado de liquidez.
COMUNIDAD POOLCOD
Un mapa de liquidaciones para leer el riesgo, no para adivinar el futuro.
poolcod reúne actividad confirmada por exchanges y zonas estadísticas en una misma visualización. Cada capa se identifica de forma separada para que puedas distinguir hechos observados de niveles calculados.
Liquidaciones ejecutadas
Son operaciones forzadas que Binance, Bybit y Gate reportan públicamente después de ejecutarse. poolcod conserva exchange, contrato, lado, precio, cantidad, importe normalizado y momento del evento.
- Confirmadas por la fuente pública del exchange.
- Visibles sobre el precio y la vela correspondientes.
- No representan órdenes pendientes ni todas las posiciones del mercado.
Pools de liquidación estimadas
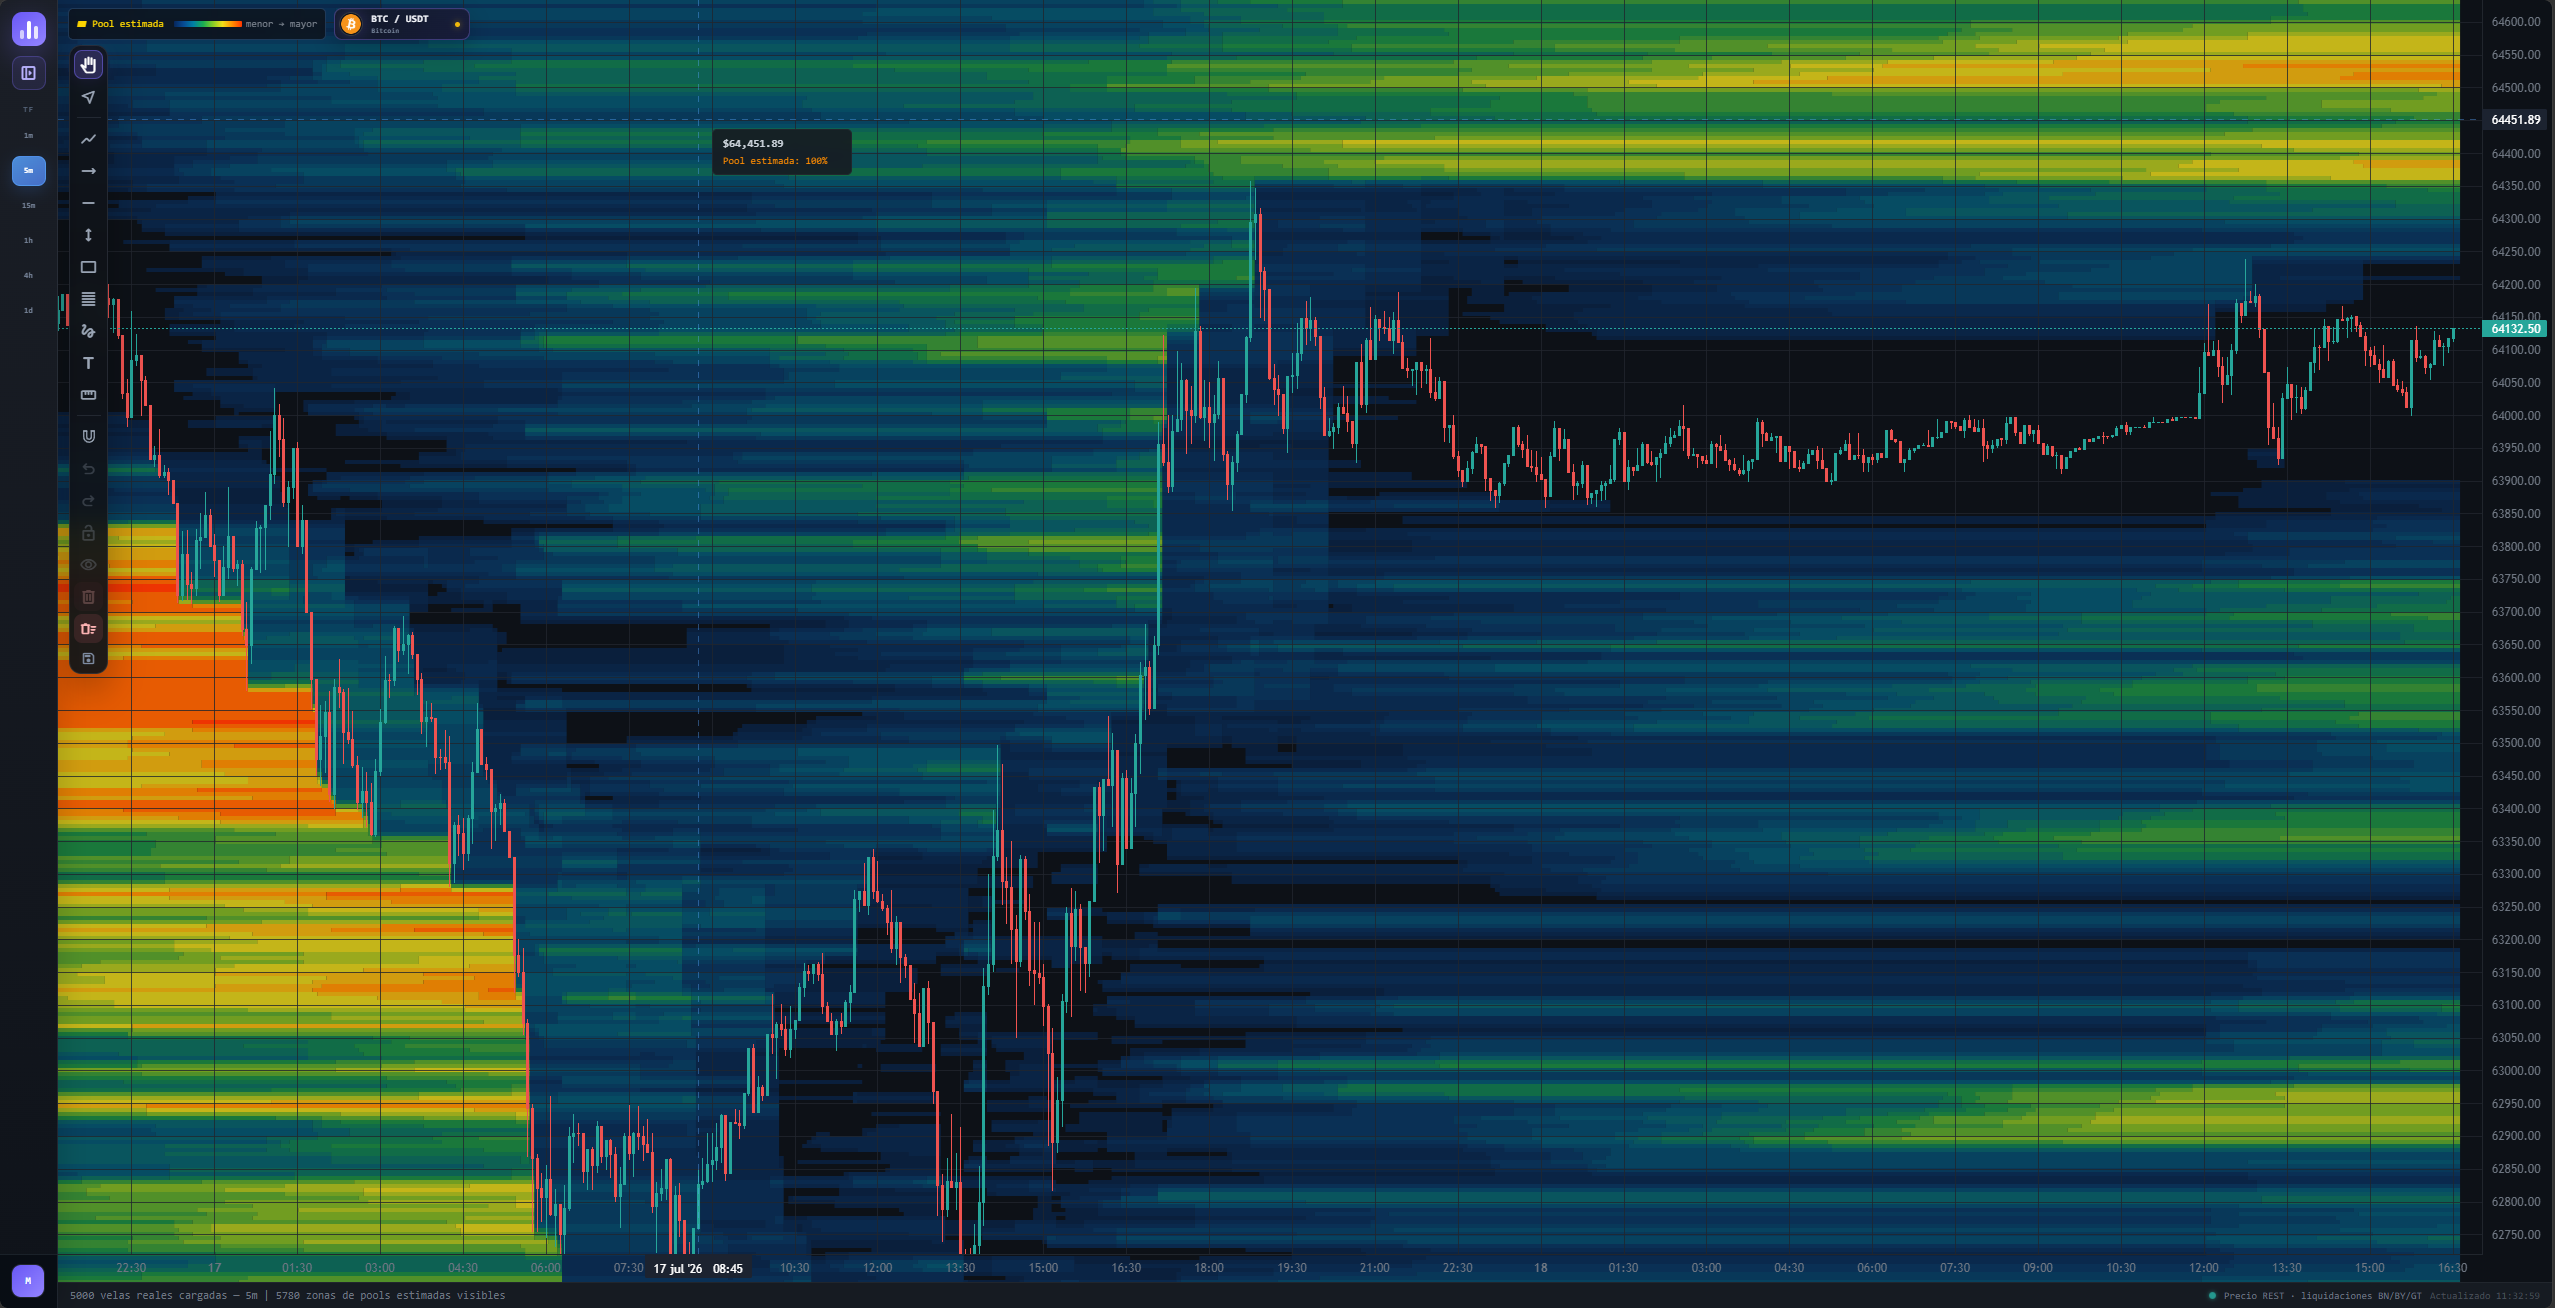
Son posibles zonas de presión calculadas a partir de velas, volumen, flujo taker, interés abierto, posicionamiento disponible y fórmulas de liquidación para varios rangos de apalancamiento.
- Incluyen niveles aproximados desde 5x hasta 125x.
- La intensidad compara concentración relativa dentro de la vista.
- No son posiciones conocidas ni órdenes confirmadas por un exchange.
Precio e historial sincronizados
Las velas OHLC, el volumen negociado, el flujo comprador y el interés abierto ayudan a interpretar cuándo una concentración aparece, permanece o es atravesada por el precio.
- Temporalidades desde 1 minuto hasta 1 día.
- Historial persistente por mercado.
- Filtros independientes para datos reales y estimados.
Prioritize the markets that deserve attention
The radar compares all 30 map markets using the latest available analysis to reduce manual review time without presenting its results as trading signals.
- Proximity to strong estimated concentrations by timeframe.
- Imbalance between zones above and below price.
- Recent activity and favorites gathered in one panel.
CÓMO LEERLO
De la intensidad al contexto en tres pasos.
Una zona brillante no es una señal automática de compra o venta. Su utilidad está en mostrar dónde podría aumentar la sensibilidad del mercado y contrastarla con lo que el precio realmente está haciendo.
-
01
Ubica la concentración
Azul indica menor intensidad relativa; verde, amarillo y naranja destacan las zonas más fuertes visibles.
-
02
Distingue la capa
Comprueba si observas una pool estimada o un punto de liquidación real ya ejecutado.
-
03
Confirma con el mercado
Revisa estructura de precio, volumen, interés abierto y temporalidad antes de sacar conclusiones.
LECTURA VISUAL
Intensidad relativa
menor → mayor
Menor concentración
Mayor concentración
Los colores se normalizan con las zonas visibles. Una línea amarilla representa mayor concentración relativa que una azul dentro del rango mostrado, no una cantidad universal ni una probabilidad garantizada.
COBERTURA MULTIMERCADO
Thirty popular USDT perpetuals in one surface.
The selection starts from CoinMarketCap and keeps only active USDT perpetuals on Binance, Bybit and Gate. The selector sorts them by recent public volume.
 BTCBitcoin
 ETHEthereum
 BNBBNB
 XRPXRP
 SOLSolana
 TRXTRON
 HYPEHyperliquid
 DOGEDogecoin
 ZECZcash
 XLMStellar
 XMRMonero
 LINKChainlink
 ADACardano
 CCCanton
 BCHBitcoin Cash
 GRAMGram
 LTCLitecoin
 DEXEDeXe
 SUISui
 HBARHedera
 AVAXAvalanche
 NEARNEAR Protocol
 UNIUniswap
 TAOBittensor
 WLFIWorld Liberty Financial
 ASTERAster
 MMemeCore
 ONDOOndo
 AAVEAave
 WLDWorldcoin
FREQUENTLY ASKED QUESTIONS
The essentials before using a liquidity map.
Is all the data shown by poolcod real?
The candles and liquidations marked as real come from public exchange sources. Pools are clearly labeled as estimated because no exchange publishes a complete map of the positions and liquidation prices of all its users.
Does an estimated pool guarantee the price will reach it?
No. It is a statistical zone of possible concentration, not a price target or a recommendation. It can disappear, weaken, or never be reached.
Why do pools change between timeframes?
Each timeframe aggregates volume, range, flow and open-interest changes differently. Changing the interval also changes the information used by the model and the visual scale of the map.
Does poolcod offer trading signals or financial advice?
No. poolcod is a visualization and analysis tool. Trading decisions are the responsibility of the user and should rely on risk management and additional sources.
GUÍAS DE LIQUIDEZ
Aprende a interpretar el mapa antes de operar.
Contenido público sobre pools de liquidez, mapas de liquidaciones y diferencias entre eventos reales y zonas estimadas. Cada guía explica qué puede concluirse de los datos y qué debe tratarse solamente como contexto.
01
GUÍA PRINCIPAL
Pool de liquidez de Bitcoin
Qué significa, cómo se representa y por qué no debe confundirse con un pool DeFi.
Leer guía 02 LECTURA DEL MAPAMapa de liquidaciones Bitcoin
Entiende colores, intensidades, temporalidades y el recorrido del precio.
Leer guía 03 METODOLOGÍAReales frente a estimadas
Conoce el origen, alcance y limitaciones de cada capa de información.
Leer comparación 04 CONCEPTOSZonas de liquidez en trading
Diferencia libro de órdenes, volumen negociado y zonas de liquidación.
Leer guía
POOLCOD LIBRARY
More information
Keep learning with more detailed analysis.
Explore every guide about liquidations, liquidity, open interest, taker flow and risk in perpetual futures.
ACCESS PLANS
Choose the frequency that suits you best.
Full access to the liquidity map, multi-market radar, all markets, estimated pools and real liquidations. Cancel anytime and keep access until the paid period ends.
NEW USER
PRO TRIAL
Free Poolcod Pro
2 days
48 hours of full access
Explore the map, the market radar and all its tools before choosing a plan.
- 30 popular markets
- Real-time pools and liquidations
- Persistent history per market
- Timeframes: 1m, 5m, 15m, 1h, 4h, 1d
- 30-market radar: proximity, imbalance and activity
- No card and no automatic charge
MONTHLY
Poolcod monthly
US$12
$49,900 COP / month
Total flexibility. Ideal for trying the map without long-term commitment.
- 30 popular markets
- Real-time pools and liquidations
- Persistent history per market
- Timeframes: 1m, 5m, 15m, 1h, 4h, 1d
- 30-market radar: proximity, imbalance and activity
- Cancellation at period end
SAVE 2 MONTHS
ANNUAL
Poolcod annual
US$120
$499,000 COP / year
Best value. A full year of liquidity analysis with annual renewal.
- 30 popular markets
- Real-time pools and liquidations
- Persistent history per market
- Timeframes: 1m, 5m, 15m, 1h, 4h, 1d
- 30-market radar: proximity, imbalance and activity
- Cancellation at period end
EXPLORA EL MERCADO
Crear cuenta
Convierte datos dispersos en una lectura más clara.
Accede al mapa completo, selecciona un mercado y compara datos reales con zonas estimadas.